Crisis management scorecards
Balanced Scorecard is a tool for autonomy of the management. It helps them prepare an explicit defense strategy for the forecasted time of crisis. This helps in controlling the influential factors in time and lessens the damage they cause both in magnitude and capacity. Due to this organizations need to depend on technology to avail well-designed tools like Balanced Scorecards detecting and identifying the events, plan of action and method of implementation for various tasks and activities objectively while channelizing all efforts in-line with the corporation targets.
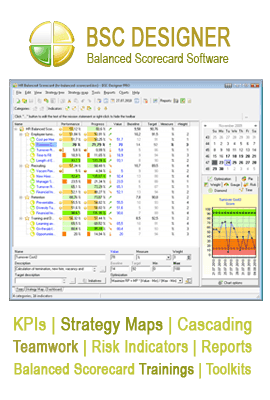
A crisis management scorecard offers the KPI – Key Performance Indicators which perform the task of benchmarking and gauging. They incorporate factors as wide as; revenues, profits, discounts, fee charged from the viewpoint of customers, finances, internal operations and growth. Not only this, it comes with a built-in option of creating customized indicators with the help of which corporate entities can quantify their outcome in a particular time. They can also map-out the control actions for upcoming circumstances. Each of these KPIs is assigned with ranges and scored against the actual performances and actions.
The result of the outcome is then categorized accordingly and stored in the central database from where it can be viewed for the purpose of analyses and study using the strategy maps which allow the management to identify the relation between each of the indicators and see how they affect the organization collectively and individually. An indicator appears next to the issues that need concern and attention automatically if the stop light tool is selected to be used. It is a warning indicator built on the signal pattern and incorporates three shades of light namely, red, yellow and green.
The use of time points is also very useful in assigning relative scores to indicators which are time dependent, the scores for the indicators can be set to remain valid for certain period of time. After which they can be changed by the management for other purposes. Using a diamond type chart, current and target values of a metric or an indicator can be highlighted for various purposes. Usually a diamond chart is represented as a triangle, the bold line of which defines the current value, the inside triangle – minimal value and the outside triangle – the maximal value respectively. In order to access the diamond chart a category is selected with more than three indicators and click the option of diamond chart mode.
Emergency situations within a workplace range from human breakdown to rumors, procedural complications and misdeeds. The key to success is defining and identifying the adverse factors from all levels of business aspect that can pose adverse threats for organizations. Managing to build detailed methodologies will help organizations to combat their crisis both in the present and future.
